The Corona Virus has stymied our learning of digital humanity tools but we were always able to adjust. Thank god, before this pandemic, we were able to learn Timeline JS in class with our beloved Professor, Dr. Najla Jarkas. Timeline JS is an open-source tool that enables anyone to build visually rich, interactive timelines. It was created by the Knight Lab in an attempt to visually convey information about an event in current or recent history by combining the timeline feature with the options of media such as audios, photos and videos. We will be giving a small tour of Timeline JS before we delve deeper into the following: TimelineJS experience, difficulties learning about TimelineJS, research project aims and goals before using TimelineJS, how TimelineJS allowed us to achieve those goals, how TimelineJS allowed us to expand our scope and include multimedia that has contributed to the research topic we chose for this project, and other features that we needed in TimelineJS in order to be able to accomplish our project goals.
Now let’s start the tour!

First type in on google Timeline JS . The result will appear immediately due to its high organic search and its increased exposure over the years. Press the first link and this should be shown on your page.
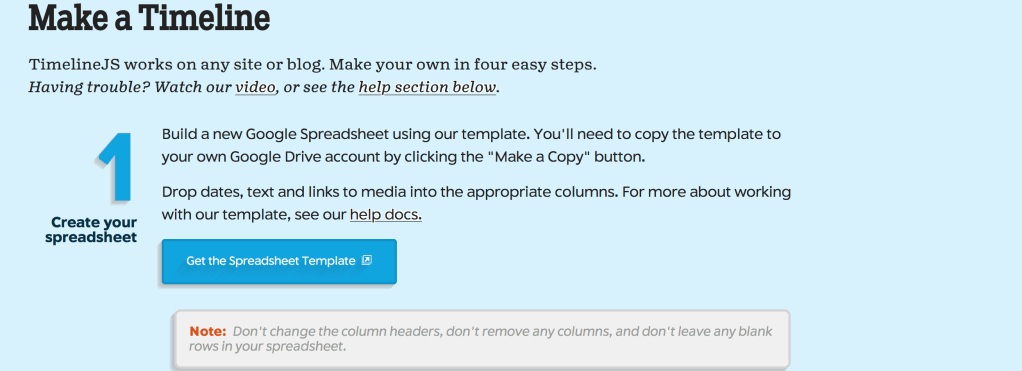
Click on “Make a Timeline” and it will directly take you straight to their bottom page. The instructions are very clear on the TimelineJS website but we will go over them so you can have a better understanding of the platform.
As a 1st step, you should create a google spreadsheet. The google spreadsheet is a must because all of your information about the topic you want to write about will be included in there to make a Timeline. After pressing “Get the Spreadsheet Template”, you will get a copy of a google spreadsheet which should look like this.
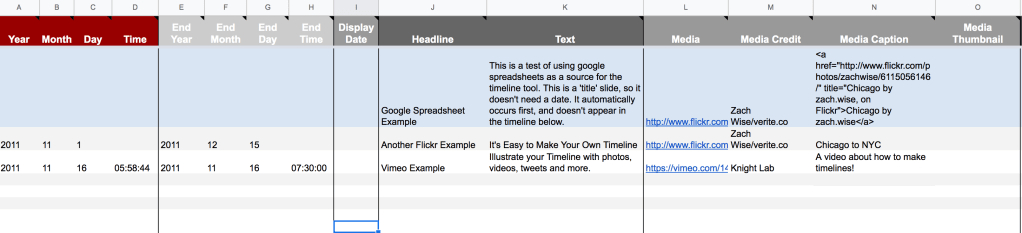
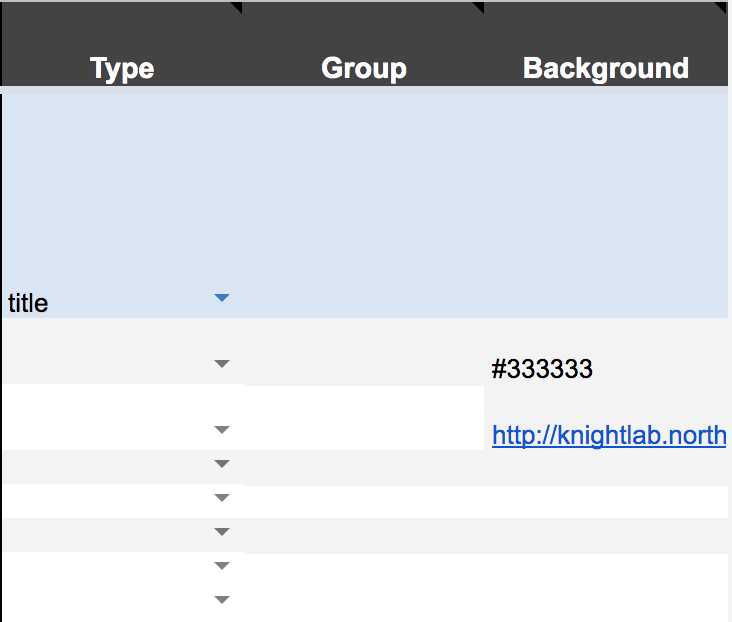
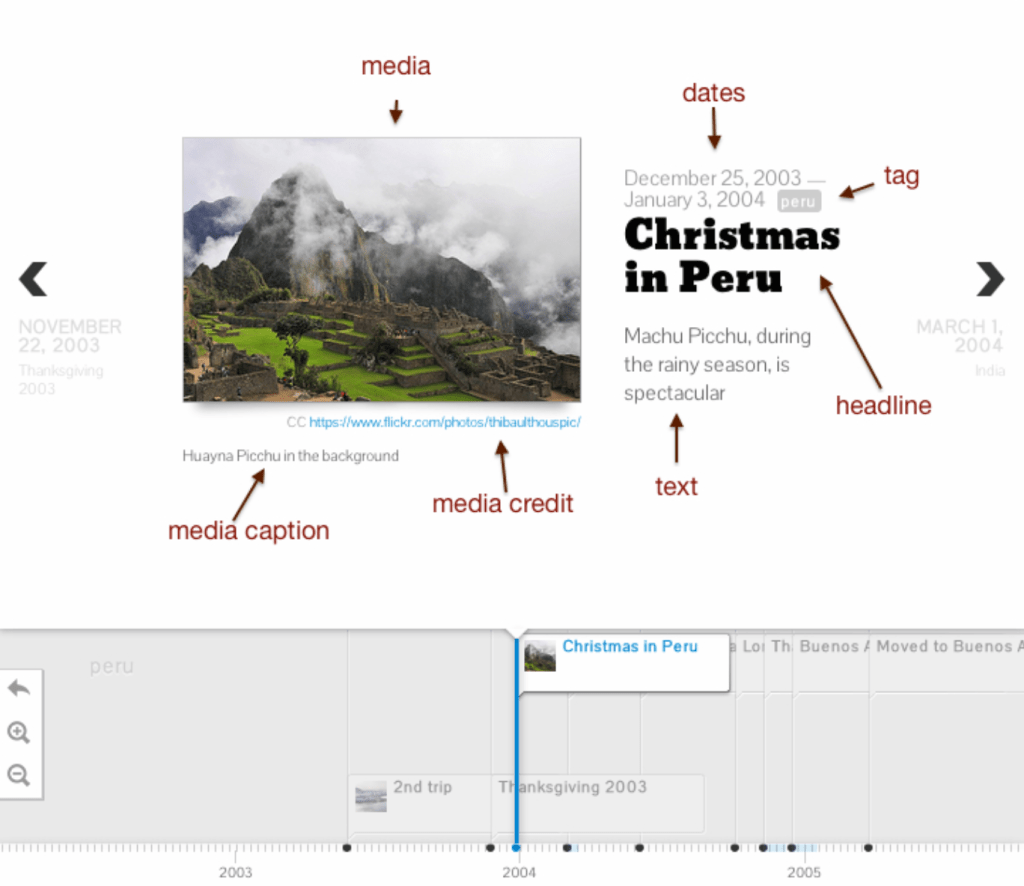
At first, the spreadsheet might get you bewildered but don’t worry we got you covered! In the year, you insert your dates that will happen chronologically. If no date is inserted, then that specific row will show first in your timeline. You can skip columns B to H as they are futile and not necessary. The Headline, column J, is like your main title for that specific slide. The text goes immediately write under the headline. The media is the picture, video or music you want to insert for that slide. Don’t worry if you get lost, an example will be shown :). In order for the Timeline to read the media column, you must copy the image address of that particular photo. Also, you must give credits to owner of the photo and write detailed caption about the photo. Promptly move to the background column and insert a link so that TimelineJS can decipher it into a visual form. In the background, you can add a gif, photo, or a color. This is how it will show on your TimelineJS.
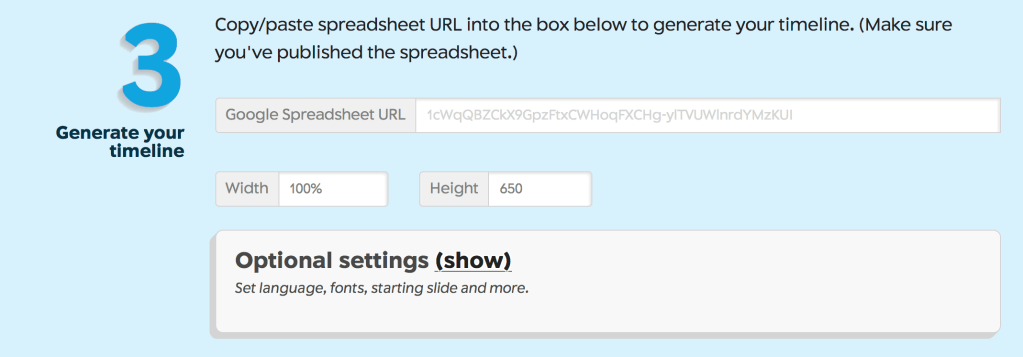
Easy right!? Now for the 2nd step. In order to transform the google spreadsheet into a timeline, you must press file. In file, click on publish to the web and then press publish. In this stage do not copy the URL that is given to you. You MUST copy the URL of the page you are on. 3rd step, copy paste your URL into the following blank space.
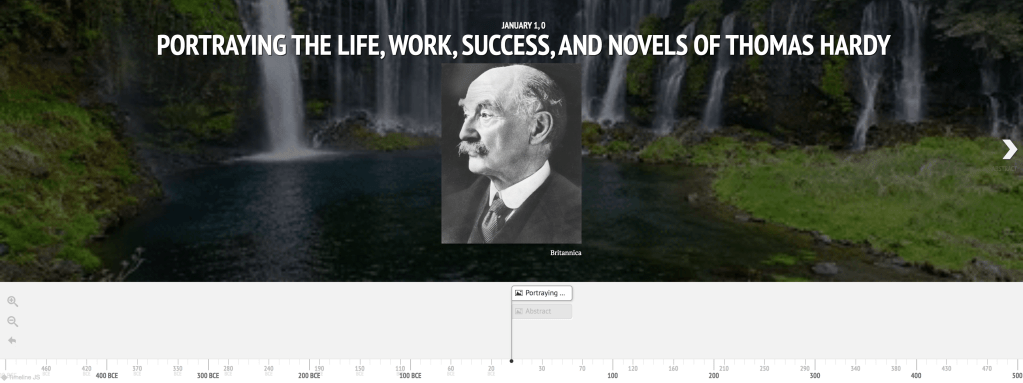
In step 4, the platform will immediately create a link for your timeline. Press Preview and Voila!! You’ll get your Timeline. We will show you a sneak peek of our awaited Timeline about Thomas Hardy!
If you had any difficulties, there are many TimelineJS tutorials on Youtube!
To be honest and without any exaggerations, TimelineJS was really amazing. Why do we say that? The reason is because TimelineJS opened our minds. Clic and Voyant were beneficial digital humanities tools for our understanding about Thomas Hardy. However, our ideas were always scattered and sporadic. The previous tools, were just analyzing Thomas Hardy and his books. In TimelineJS, it is quite unique. It is different because now we can write about everything. We can combine everything into one place and get a better understanding of Thomas Hardy as an author. We can know more about his early life, his wife, his childhood, his education, his perceptions and etc. Not only that but we can know how his life went in a chronological order. All of this is essential and prominent because analyzing an author is futile without understanding his background. By the way, most of his books are related to his own personal life. As a group, TimelineJs has helped us research Thomas Hardy in a different way. The platform helped us in dividing and assembling our ideas in a more organized way. We feel now that we see Thomas Hardy better because we are able to move step by step. From the moment he was born to the moment he died. Moreover, we were able to combine all of our previous prominent analysis (Clic, Voyant, and Google my Maps) into one platform. The platform synchronized and made a strong connection with our analysis about Thomas Hardy and about his life. Therefore, it exposed us to different findings about Thomas Hardy when we did the Timeline. While we were searching of what impacted Thomas Hardy to start writing novels, we found that part of his motivation to write was religion. That was very interesting to us because we noticed that TimelineJs made us dig deeper into the author. You can’t even miss a tiny bit of detail or your work is pointless. The Timeline should be very precise because dates are the gist of the platform. To show you how TimelineJS made things much easier for us.
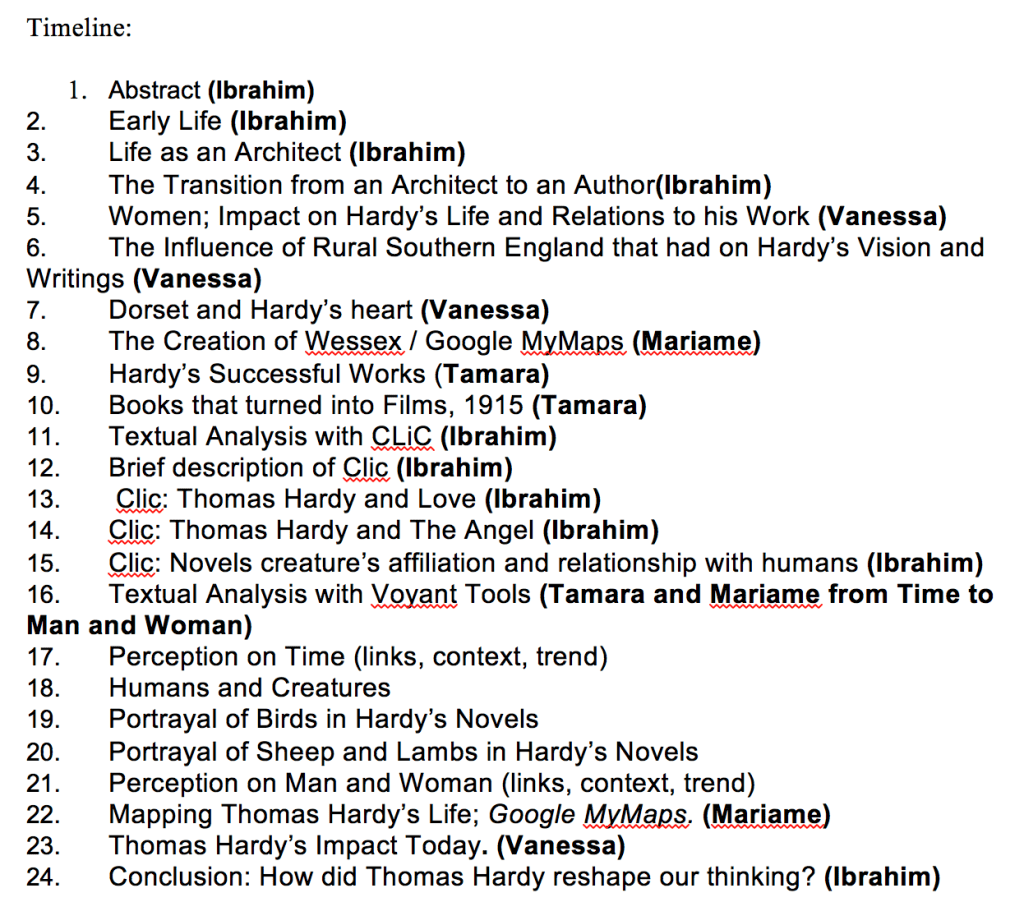
This is what we are actually doing now as a group for our project. We were able to organize our ideas and put our previous analysis into work. Thanks for TimelineJS! Of course, there are pros and cons for each platform and we will describe them throughout the Blog.

At first, we had ambivalent feelings. Is it so hard to learn or is it easy to get used to? However, we found TimelineJS very user-friendly. The learning in class was beneficial and self-learning would have been manageable. When you open the google spreadsheet from the platform, they show you an example of how it is done.
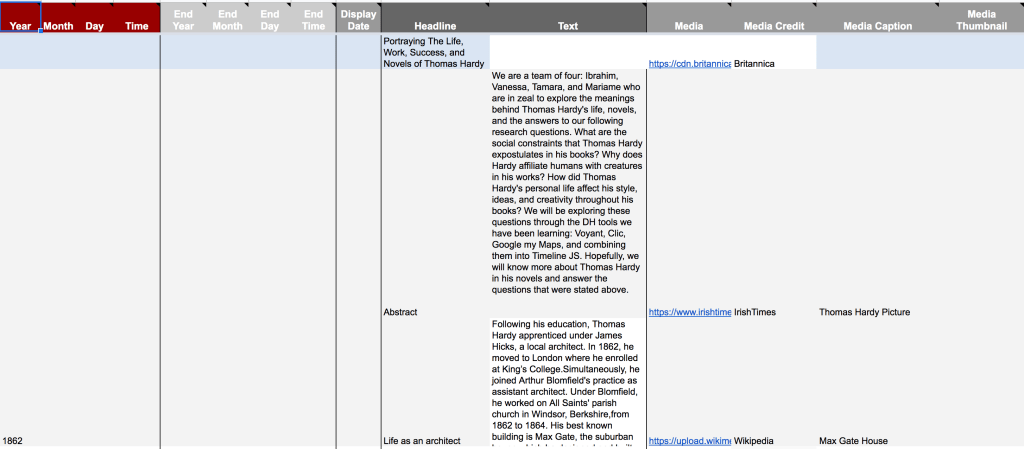
The spreadsheet is very easy to use. They show you an example and you just need to replace the examples with your own information. Each column speaks for itself. For example, in media, you add a YouTube video, sound cloud music, or a picture. The same goes for the other columns. Even if we were not taught in class about how to use the platform, we would have gotten the hang out of it because it is easy. In the TimelineJS website, they show you instructions and the 4 steps on how to create the Timeline which are very easy and they were already described in the part above. This is an example of our spreadsheet about Thomas Hardy.
It is very easy to do! Now you just copy past the URL and the spreadsheet will transition to a beautiful visual timeline form. It is user-friendly because the spreadsheet talks for itself but of course there were some minor difficulties which will be discussed in the blog.
TimelineJS is not very easy to use at first. The first time we used this tool, we were expected to add pictures, backgrounds, different texts etc. Sometimes, the media wouldn’t work and the pictures wouldn’t show because we copied the wrong links. We thought that creating a timeline would be very strenuous. However, after a few practices, we got the hang of it quickly. There are some technical aspects about TimelineJS that we wished were available and that could have made TimelineJS much more appealing. For example, We couldn’t change the font to our specific needs, so sometimes the texts would look very rudimentary. Also, underlining and putting some words in bold isn’t possible so if we wanted to emphasize on a certain word or idea, we couldn’t do that. Moreover, we can’t put colors on the text, and sometimes having colors could be intriguing for the readers. In addition, we couldn’t crop the pictures that we added and we couldn’t change the alignment of the pictures. Sometimes this could be disturbing because it would block our background picture. Therefore, unnecessary parts of a picture cannot be removed. Also, we couldn’t put two pictures in one slide, since sometimes we would want to show two ideas in one slide and the evidence needed was in two different pictures. For example, this is a timeline with a appealing colors to showcase our presentation.
This could be a very nice feature on TimelineJS to project a more attractive presentation. However, TimelineJS is not hard at all. It does seem like that at first but the instructions were crystal clear on google spreadsheet which made it much more easier.
Moreover, various DH tools we were introduced to, such as Google MyMaps, Topotext, Voyant Tools and CLiC, truly allowed us to dig deep into the background of Hardy’s novels, and discover things that were unknown at first glance. We thoroughly analyzed the relevance of word frequencies, the positive or negative connotations associated with them, along with geographical locations, and Hardy’s background that influenced his life and writing. The aforementioned DH tools provided us with the necessary information to create an illustration of Hardy’s life in the form of a timeline using TimelineJS. We are able to embed maps and include pictures, gifs, figures, videos, soundtracks, and screenshots in our timeline in order to create a constructive demonstration of the events that occurred in his life and works. Additionally, the backgrounds have to be chosen at a certain length and height in order to coincide the main multimedia, and the corresponding text. Nevertheless, due to the great features that TimelineJS offers, we are able to showcase all the work we have done for this project in a very organized, concise, and appealing way. The idea of a chronological project truly allows the reader to walk through Hardy’s life like a story, gaining a deeper understanding behind his work and personality. The fact that people can switch back and forth is very engaging and gives the reader the control as though they are part of the presentation.
We chose Thomas Hardy as our topic for our research project for many reasons. After learning about his poor life and then winning the Nobel Prize (What a transition!), we were interested to see how Thomas Hardy led his life. Thomas Hardy went through different stages in his life before becoming a famous author. Using tools before TimelineJS, we came to discover that he was interested in topics such as time, inequality between man and woman, the affiliation of creatures to humans etc. We saw these perceptions very intriguing as to why he conceived and criticized people in that sense. We were in zeal in getting to know Thomas Hardy’s life and how his life reflected in his novels. We wanted to know his background life, his marriage, his criticism about social class and disparity between men and women, and his relationship with creatures in his novels. All of these were our project aims and goals we wanted to achieve about Thomas Hardy. TimelineJS did in fact allow us to achieve our goals in a certain way. We were able to see the evolution of Thomas Hardy as a poor and pure person to an author. This tool gave us the chronological order of the events in Thomas Hardy. TimelineJS allowed us to see how Thomas Hardy evolved as a writer, and the different phases he went through to reach where he was. The platform made us go into more details on how and why Thomas Hardy made these transitions. We were able to exploit the platform in every way possible by adding our previous analysis. We were able to add our prominent interpretations of our goals and objectives about Thomas Hardy which are the following: Why does Hardy affiliate humans with creatures in his works?How did he perceive men and women? What was his opinion about the social status and why? His perception of time? His opinion about marriage? All of these wouldn’t have been possibly done if TimelineJS wasn’t available as it is quite essential. The reason why is because TimelineJS lets you see things step by step. From the moment he was born to when he was an author and to the day he died. Moreover, his life could show you the chemistry with his novels all in one platform. This is an advantage as it projects a better understanding of the author Thomas Hardy.
Finally, working with TimelineJS has been a great experience so far, and the simplicity with using it developed gradually throughout the semester, making it our favorite to work with. The only thing we struggled with at the start was that the site itself does not provide us with the same clear detail that was available for us on the google docs and in class on how to input media, copy and paste links correctly, find color codes, and a tutorial on what each column represents. We feel a tutorial would have helped us more, although we were provided the necessary guidance by our professor online and in class. Also, since our group is familiar with google spreadsheets it did help us accomplish our tasks quickly and effectively. Nonetheless, our experience with DH tools in this course was very educational and enjoyable. We discovered so much more about Thomas Hardy than we would have if we were to complete regular research, as this form of analysis dug deep into the context and connections in his work. Hopefully, TimelineJS will interactively illustrate our analyses and findings. Overall, it was a great experience getting introduced to such useful DH tools. We would like to thank ENGL256B for opening our eyes to a great world of digital humanities.
This blog is a collaborative work between Vanessa El Ali, Mariame Allaw, Tamara Haidar, and I!
